
A quality of a measurement. The amount of care taken when a measurement is performed. A quality associated with the refinement of an instrument.
Accuracy refers to the closeness between measurements and their "true" values. The farther a measurement is from its true value, the less accurate it is. Precision, on the other hand, pertains to the closeness to one another of a set of repeated observations of a random variable. Thus, if such observations are closely clustered together, then these observations are considered to have been obtained with high precision. A measurement that is precise is not necessarily accurate.
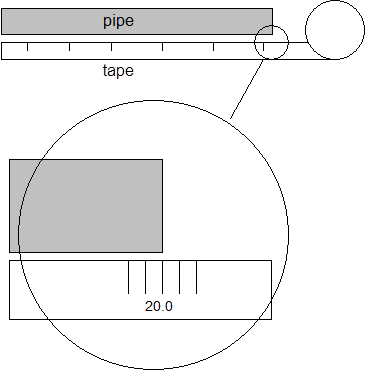
Example: We are measuring a length of pipe with a tape measure:

We get three groups of four people each to take the measurements and we get the following results:
|
Group |
Measurement 1 |
Measurement 2 |
Measurement 3 |
Measurement 4 |
|
No. 1 |
20.1 |
20.0 |
19.9 |
19.95 |
|
No. 2 |
18.95 |
19.02 |
19.0 |
19.05 |
|
No. 3 |
18.8 |
21.2 |
19.5 |
30.3 |
Groups 1 and 2 had relatively precise measurements with variations of 0.2 and 0.1 respectively. Group 3 has lower precision with a variation of 2.4. We discount the group 3’s measurement number 4 at 30.3 because that clearly seems wrong. This last measurement is called a gross error.
Notice that group 2’s measurements have small variation so were precise but the values are wrong (let’s say the true value is 20.0). Their measurements center around 19. So group 2 has precise measurements but not very accurate measurements. Group 1 has both precise and accurate measurements.
Group 2 perhaps had a tape measure that was not manufactured properly. This would be called a systematic error.
The random errors affect the precision of the system. The precision, gross errors and systematic errors all affect the accuracy of the system. So if the gross errors and systematic errors are small, the precision should be close to the accuracy.
In the output of PhotoModeler (i.e. the Measurements Pane, Point Table, Project Status Report), precision refers to the expected spread of the value about its estimated value (just as with the random errors shown with the tape measure above). A precision of 0.1 mm refers to the width of the spread of one standard deviation of a normal Gaussian probability curve. The "true value" may or may not fall within the precision of the estimated value and so precision is not a measure of accuracy. These precision numbers can be used as estimates of accuracy if the gross errors and systematic errors can be assumed to be negligible.
Note that after version 5.2.3 all output precisions in PhotoModeler are scaled by the a posteriori sigma0. There is some debate in the photogrammetry community whether this is correct but if the a posteriori sigma0 (see Final Total Error) is different than 1.0 then scaling the precisions makes the precisions more useful (and independent of the input precision values). There is an ini setting for turning this precision scaling off (contact technical support if you feel this is required).
The precision values will give you good estimates of how well the project is solving and also the relative precisions give good feedback. For example, if the Z coordinate precisions on Object Points in the project are all ten times as big as the X and Y coordinate precisions then you can see there is some weakness in the project and the Z values cannot be depended on as much.
One more example comparing accuracy and precision: The project is the measurement of a road accident scene. The project solves well and the point precisions come out to around 0.5 inches. This means that if there are no gross or systematic errors in the project then the accuracy could be around 0.5 inches (this is the one sigma 68% probability). But let’s say the tape measure that was used to measure the project scale was off by 25%. The project is still precise but it is not accurate. All the measurements are scaled the same in this project and hence will be off 25% from their “true” values.